Is XRP Heading for $0.62 Retest? Bollinger Bands Challenge Spring Recovery Hopes
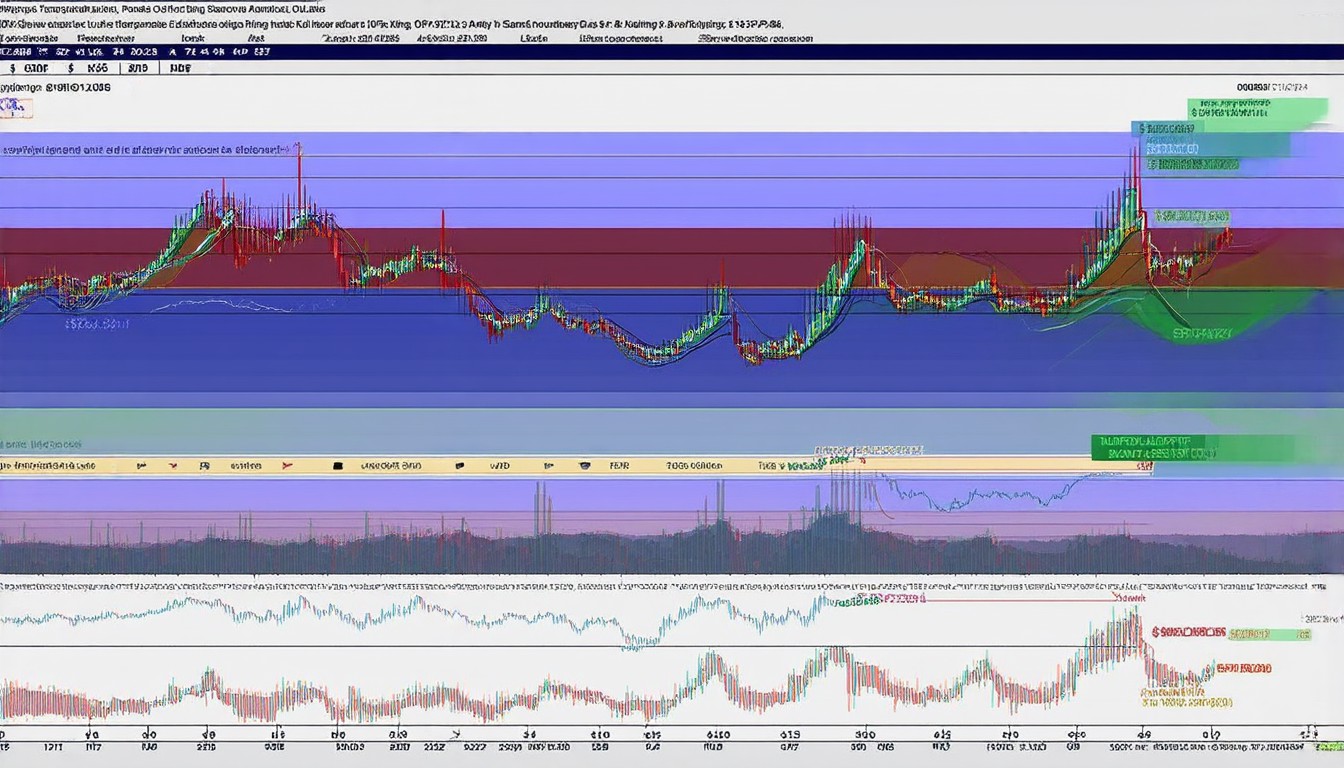
XRP monthly chart reveals a six-month bearish streak. With the lower Bollinger Band sitting at $0.6161, a 50% correction looms if the $1.30 support fails.
The cryptocurrency market has been witnessing significant volatility in recent months, with many investors closely watching the performance of XRP, the native cryptocurrency of the Ripple payment network. As the market continues to navigate through a period of uncertainty, the question of whether XRP is poised to retest the $0.62 level has become a topic of interest among traders and analysts.
The recent XRP monthly chart reveals a six-month bearish streak, which has raised concerns about the potential for a deeper correction. This bearish trend has been accompanied by a decline in the cryptocurrency's price, with investors now wondering if the $1.30 support level will hold or if it will be breached, triggering a more substantial downward movement.
A key factor influencing this potential correction is the positioning of the Bollinger Bands on the XRP chart. The Bollinger Bands are a technical analysis tool that helps traders identify trends and potential reversals in the market. The bands are calculated as a multiple of the standard deviation away from a simple moving average, typically set at 15 periods for the XRP chart.
Currently, the lower Bollinger Band is situated at $0.6161, which is just below the $0.62 level that many traders have been watching. If the XRP price were to fall below this lower band, it could signal a significant shift in momentum, potentially leading to a 50% correction from its recent highs. A 50% correction would imply a substantial drop in value, as it would mean the price would need to fall to around half of its current level from the peak of the recent uptrend.
The $1.30 support level plays a crucial role in this scenario. If the XRP price manages to hold its ground at this level, it could provide a foundation for a rebound, potentially allowing the cryptocurrency to recover and challenge the upper Bollinger Band. However, if the support level is breached, it could open the door for a more substantial decline, with the lower Bollinger Band acting as a potential target for the price to retest.
This situation highlights the importance of technical analysis in gauging market sentiment and predicting potential price movements. While the Bollinger Bands provide valuable insights, it is essential to consider other factors as well, such as on-chain data, market sentiment, and broader economic indicators. These elements can help traders and analysts make more informed decisions about the potential future trajectory of XRP.
In conclusion, the XRP market is currently in a precarious position, with the cryptocurrency facing the possibility of a 50% correction if the $1.30 support level is breached. The lower Bollinger Band's positioning at $0.6161 adds to the uncertainty, as a break below this level could signal a significant shift in momentum. As traders and analysts watch this closely, it remains to be seen whether XRP will be able to rebound and challenge the upper Bollinger Band or if it will continue to face downward pressure. Regardless of the outcome, this situation underscores the importance of staying informed and adaptable in the ever-changing cryptocurrency market.