Ethereum Price Analysis: Will ETH Break Out or Plunge to $1.8K Next?
Ethereum’s price action continues to reflect a market in equilibrium, where neither buyers nor sellers have established decisive control. Following the sharp corrective phase earlier in the year, ETH has transitioned into a broad consolidation structure, with volatility compressing as the market searches for direction. Ethereum Price Analysis: The Daily Chart On the daily timeframe, […]
Ethereum Price Analysis: Will ETH Break Out or Plunge to $1.8K Next?
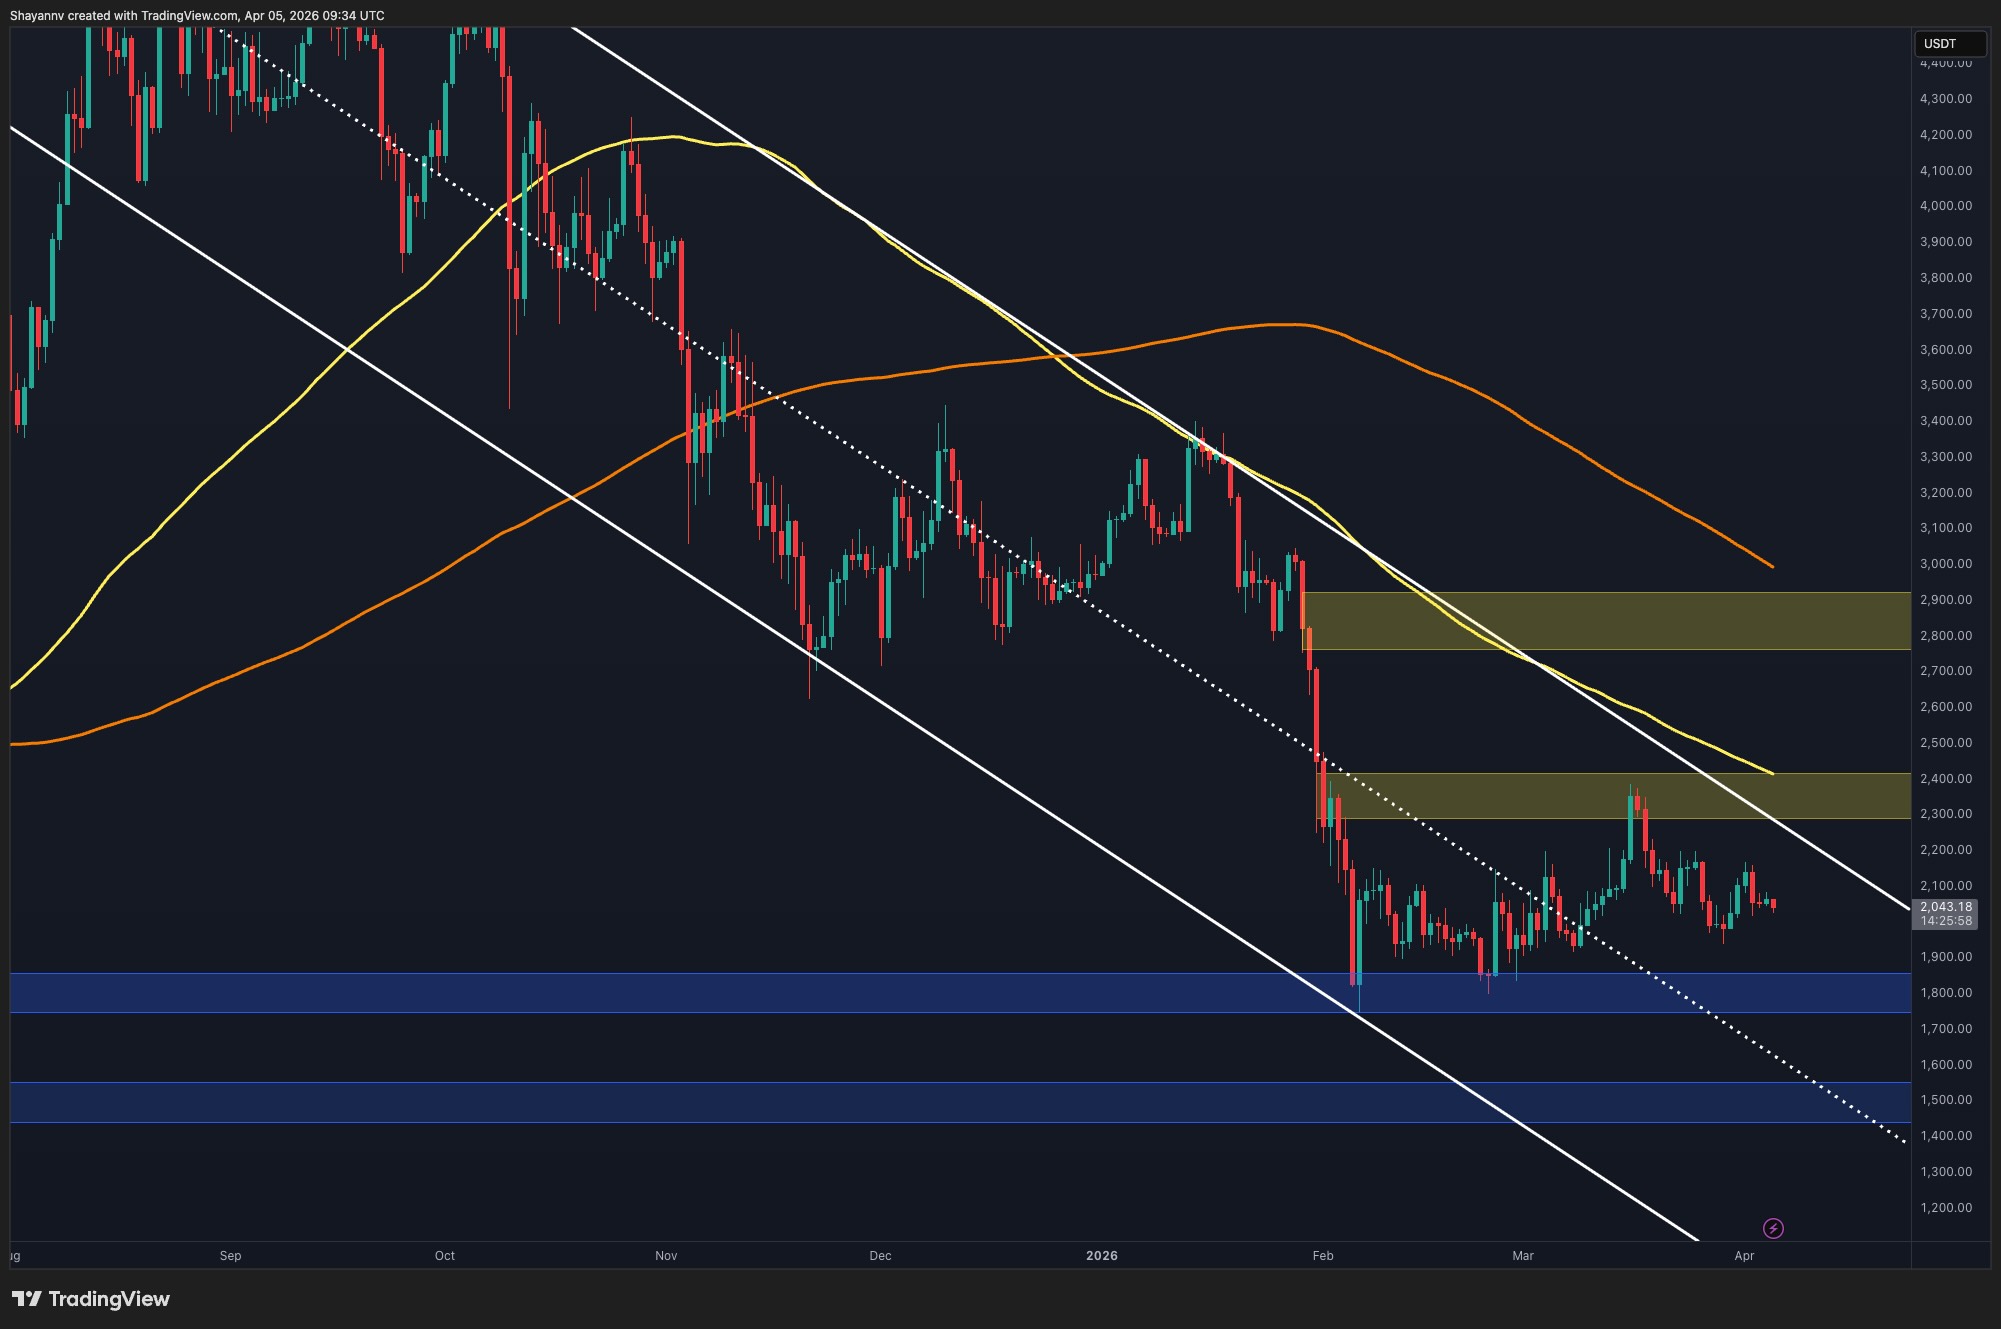
Ethereum's price action continues to reflect a market in equilibrium, where neither buyers nor sellers have established decisive control. Following the sharp corrective phase earlier in the year, ETH has transitioned into a broad consolidation structure, with volatility compressing as the market searches for direction. This state of balance between accumulation and distribution has resulted in a range-trading environment, where the asset oscillates between the $1.8K support and the $2.4K resistance zone.
On the daily timeframe, Ethereum is clearly bounded within this well-defined range. The asset has repeatedly reacted to both boundaries, confirming them as key areas of supply and demand. The recent price action further reinforces this narrative, as Ethereum continues to oscillate within this range without any sustained breakout attempt. This indicates that market participants are positioning rather than committing to a directional move. As long as the price remains within this range, the broader outlook stays neutral, with range-trading conditions dominating the market structure.
A decisive breakout from either side of this range will likely define the next major trend. A confirmed move above $2.4K would signal strength and open the path toward higher resistance levels, potentially leading to a significant upward momentum. This breakout would indicate that buyers have gained the upper hand, and the market is ready to advance beyond the current consolidation. Conversely, a breakdown below $1.8K would invalidate the current consolidation and expose the market to deeper downside continuation. Such a move would suggest that sellers have gained control, and the price could face further pressure, potentially testing lower support levels.
Zooming into the 4-hour timeframe, the structure reveals a rising wedge formation developing within the broader range. This pattern typically reflects weakening bullish momentum, as the price continues to make higher highs and higher lows, but with diminishing strength. The wedge suggests that the recent upward movements are corrective rather than impulsive, aligning with the broader consolidation observed on the daily chart. As the price approaches the apex of this formation, a breakout becomes increasingly likely.
A downside break of the wedge would confirm the corrective nature of the structural movements, potentially leading to a retest of the $1.8K support. This scenario would signal that the upward momentum is not sustainable, and the market may enter a period of extended consolidation or even a downtrend. On the other hand, an upward breakout from the wedge could reinforce the bullish narrative, potentially leading to a more significant price increase. However, this would still depend on the price breaking through the $2.4K resistance zone, which has proven challenging in recent weeks.
In conclusion, Ethereum's price action remains in a state of equilibrium, with the asset consolidating between the $1.8K and $2.4K levels. The market's direction will likely hinge on a decisive breakout from this range. A break above $2.4K could signal a resumption of bullish momentum, while a break below $1.8K could trigger a deeper downside continuation. Investors should remain cautious and monitor closely the price action, as the next few days could determine the direction of the Ethereum market in the near term.